Is A Turnaround For Price Next?


On-chain data shows that the active addresses of Bitcoin have seen a reversal recently, which could be positive for the cryptocurrency’s price.
Bitcoin Daily Active Addresses Have Been Climbing Up Recently
According to data from the market intelligence platform IntoTheBlock, Bitcoin has recently seen a rise in its Daily Active Addresses. An “active address” is participating in some transaction activity on the blockchain.
The Daily Active Addresses metric keeps track of the unique total number of such addresses becoming active daily. The indicator naturally takes into account both senders and receivers.
When this metric’s value goes up, a larger number of addresses are making moves on the network. As unique addresses can be considered the same as unique users on the chain, this trend implies the cryptocurrency is receiving more traffic.
On the other hand, the declining indicator suggests the blockchain is becoming less active, a potential sign that the investors are losing interest in the asset.
Now, here is a chart that shows the trend in the Bitcoin Daily Active Addresses over the last few months:
Looks like the value of the metric has been going up in recent days | Source: IntoTheBlock on X
As is visible in the above graph, the Bitcoin Daily Active Addresses has observed a notable jump recently, with its value crossing above the 900,000 mark at the peak.
This means that over 900,000 addresses made transactions within 24 hours. “This peak is part of a bigger trend, as activity has been slowly increasing since early June,” notes the analytics firm.
Before this recent uptrend, the indicator had declined as users had started paying less attention to the coin. With this increase, though, the Daily Active Addresses has recovered to mid-April levels.
Historically, rallies have been more sustainable when constant fuel in the form of more users has flowed in. As such, an increase in the Daily Active Addresses can pave the way for price surges to start for Bitcoin.
Thus, it remains to be seen whether this latest spike in activity would also provide a foundation for the cryptocurrency to kick off some fresh bullish momentum.
In other news articles, bullish bets appear to rise in the Bitcoin derivatives market, as CryptoQuant community manager Maartunn pointed out in an X post.
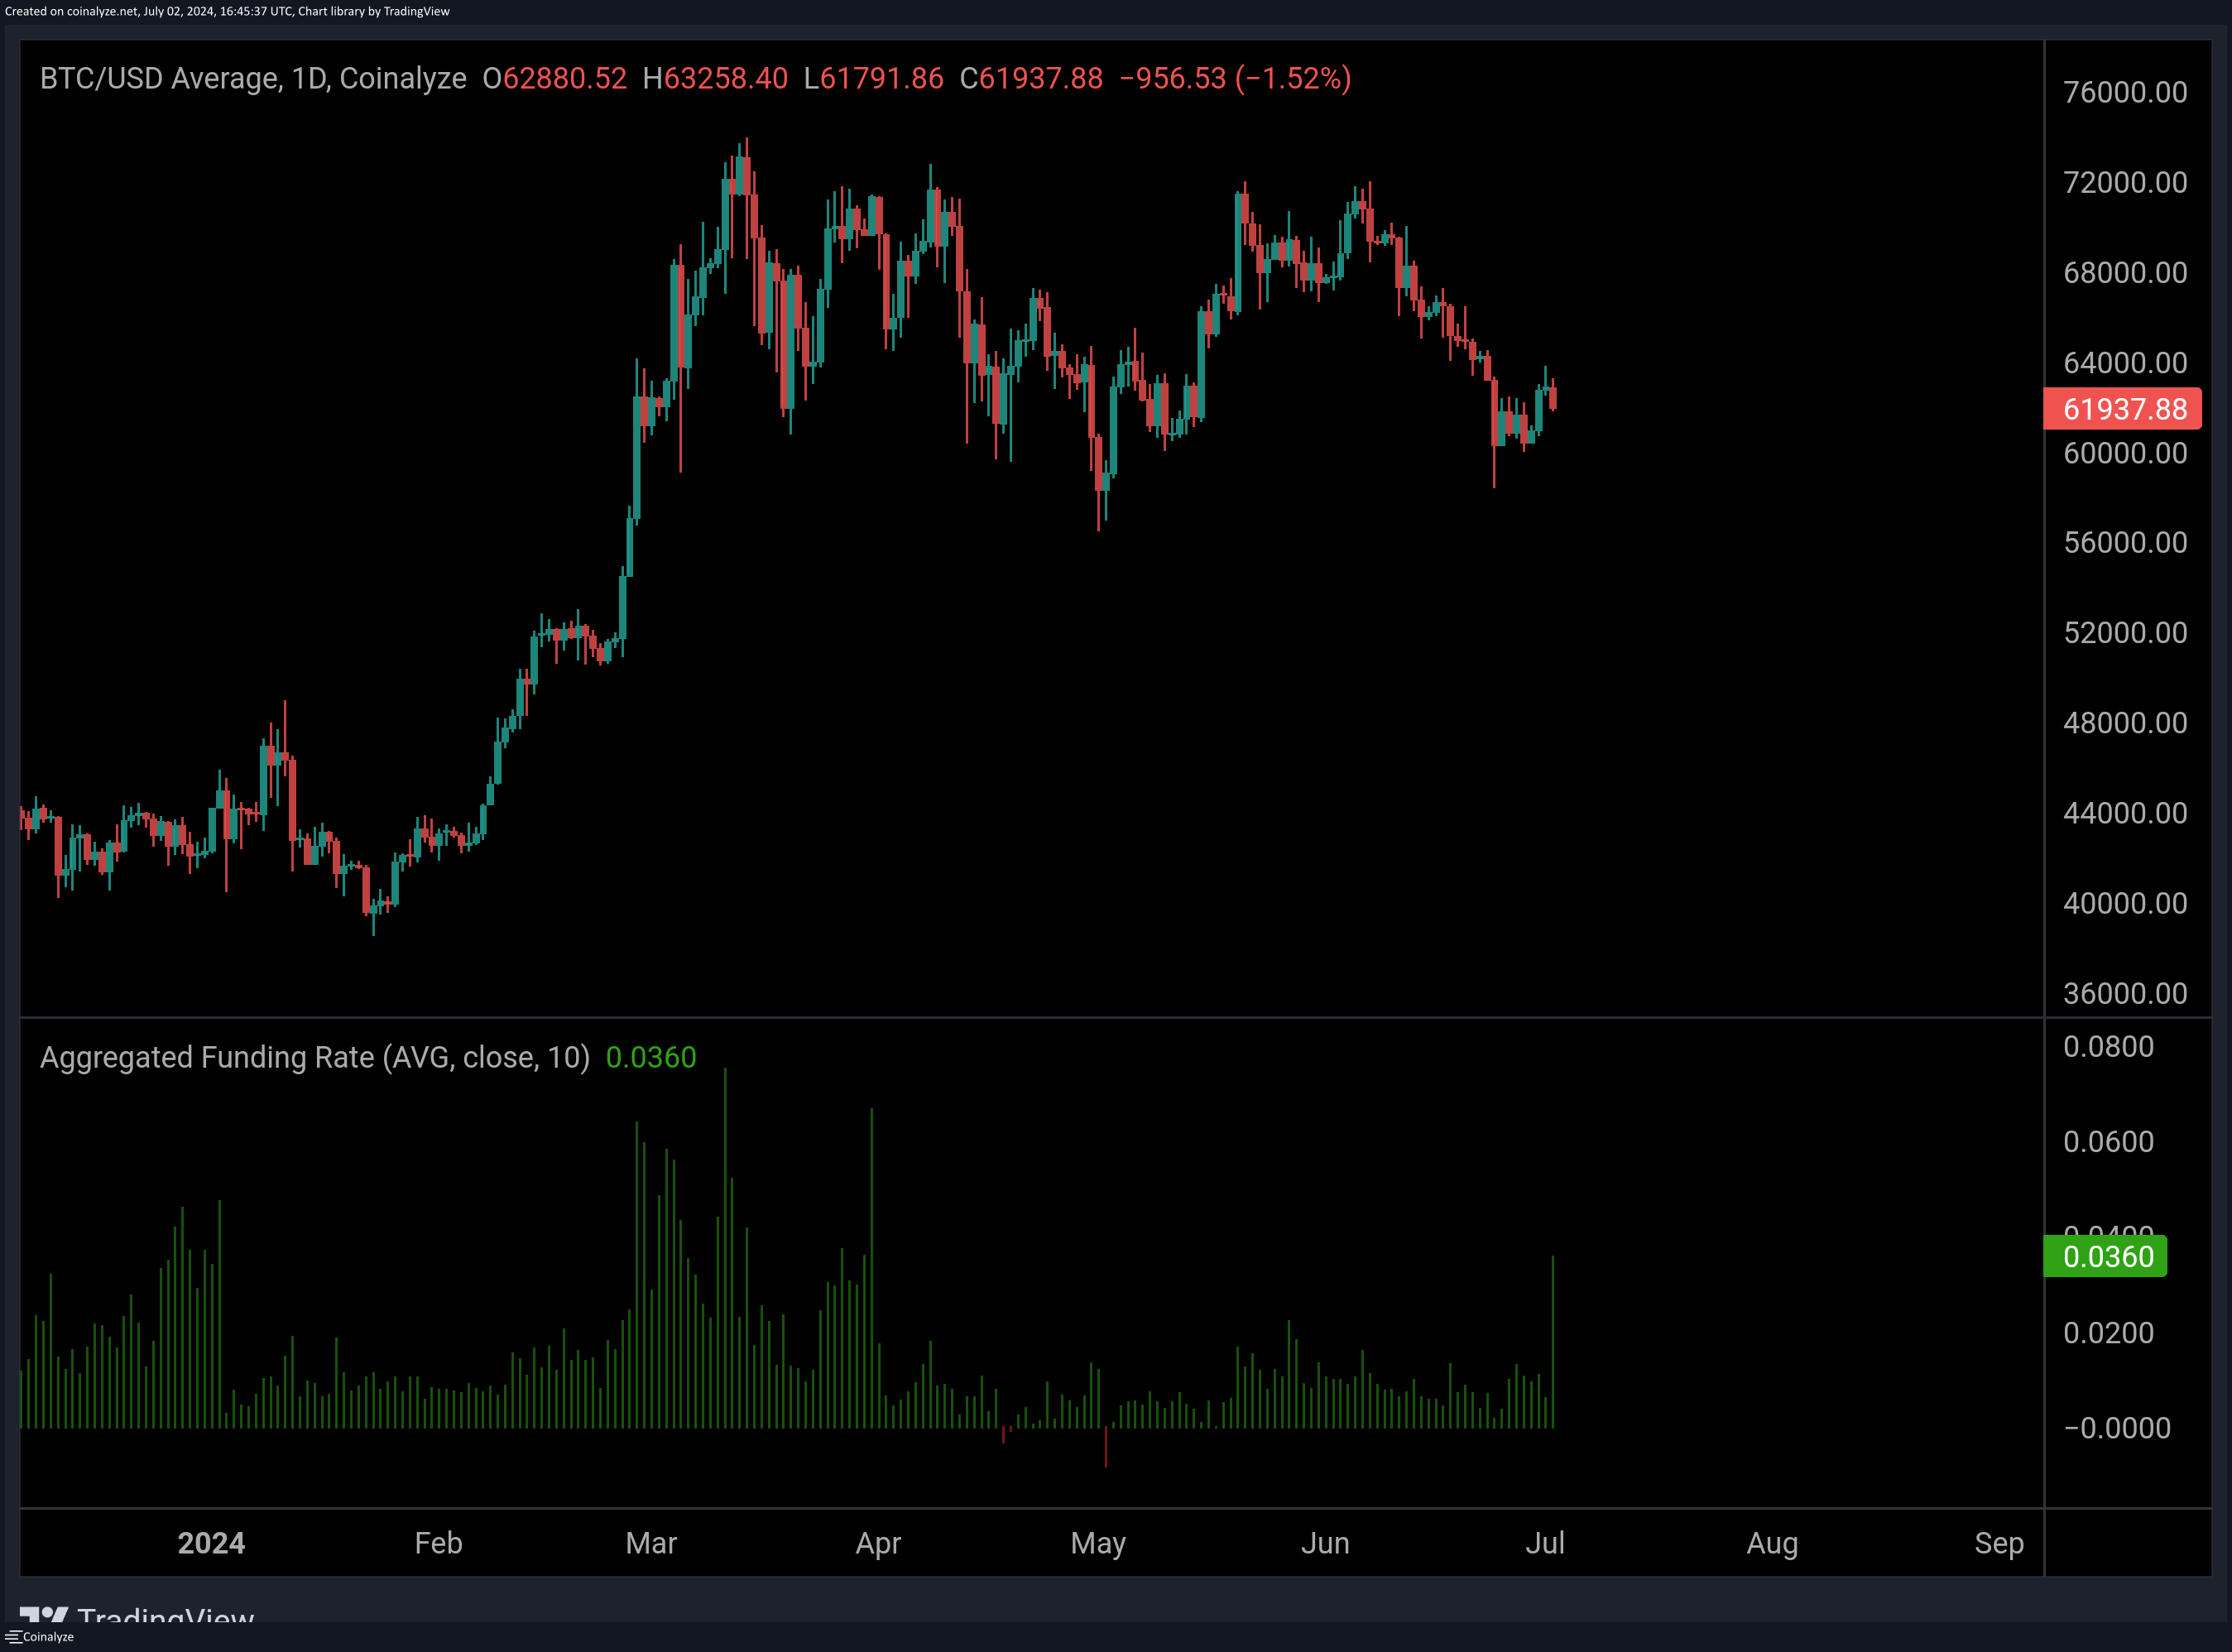
The data for the BTC funding rates over the last few months | Source: JA_Maartun on X
As displayed in the chart, the Bitcoin funding rate has seen a positive spike recently, suggesting the long contract holders notably outweigh the short ones. Historically, such a dominance of bullish sentiment has not been a positive sign for the cryptocurrency’s price.
BTC Price
At the time of writing, Bitcoin is floating around $61,900, down more than 2% over the past 24 hours.

The price of the coin seems to have been consolidating recently | Source: BTCUSD on TradingView
Featured image from Dall-E, IntoTheBlock.com, charts from TradingView.com